Population distribution refers to how people are spread out over the planet/country. Population density refers to how many people there are per km2 in an area.
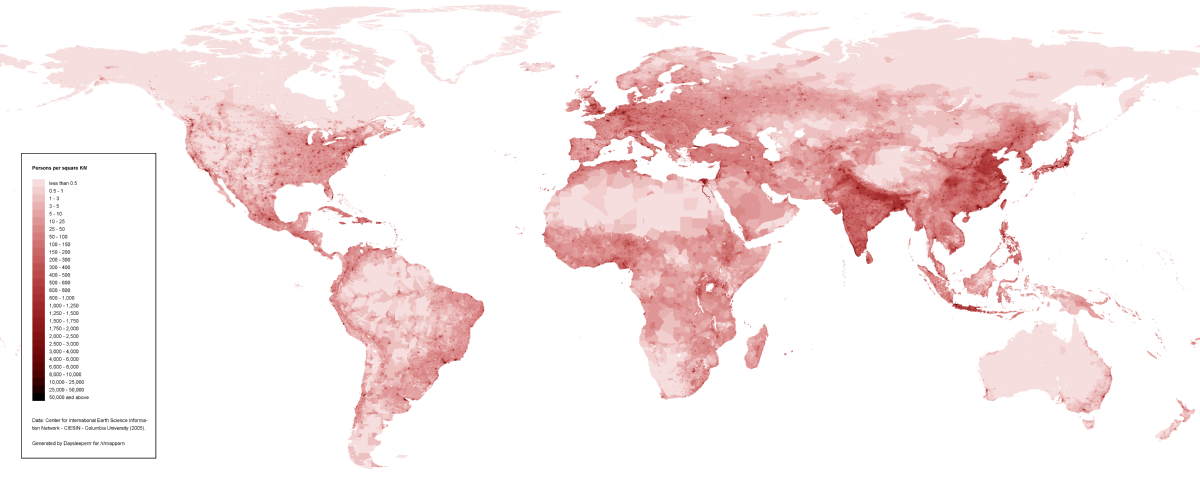
Describe the distribution of world population.
Suggest reasons for the pattern shown:
human factors
physical factors
Identify 3 areas that are densely populated and 3 that are sparsely populated.
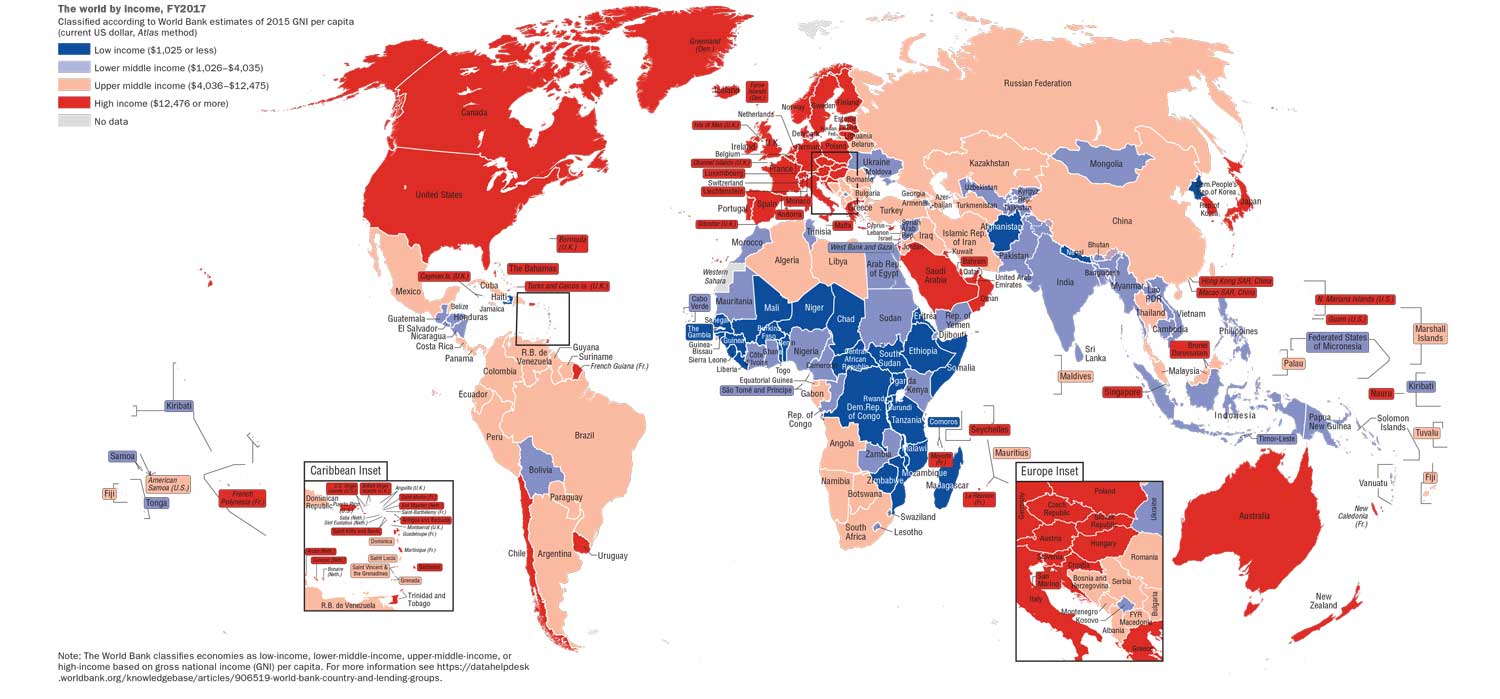
"For the current 2017 fiscal year, low-income economies are defined as those with a GNI per capita, calculated using the World Bank Atlas method, of $1,025 or less in 2015; lower-middle-income economies are those with a GNI per capita between $1,026 and $4,035; upper-middle-income economies are those with a GNI per capita between $4,036 and $12,475; high-income economies are those with a GNI per capita of $12,476 or more." World Bank
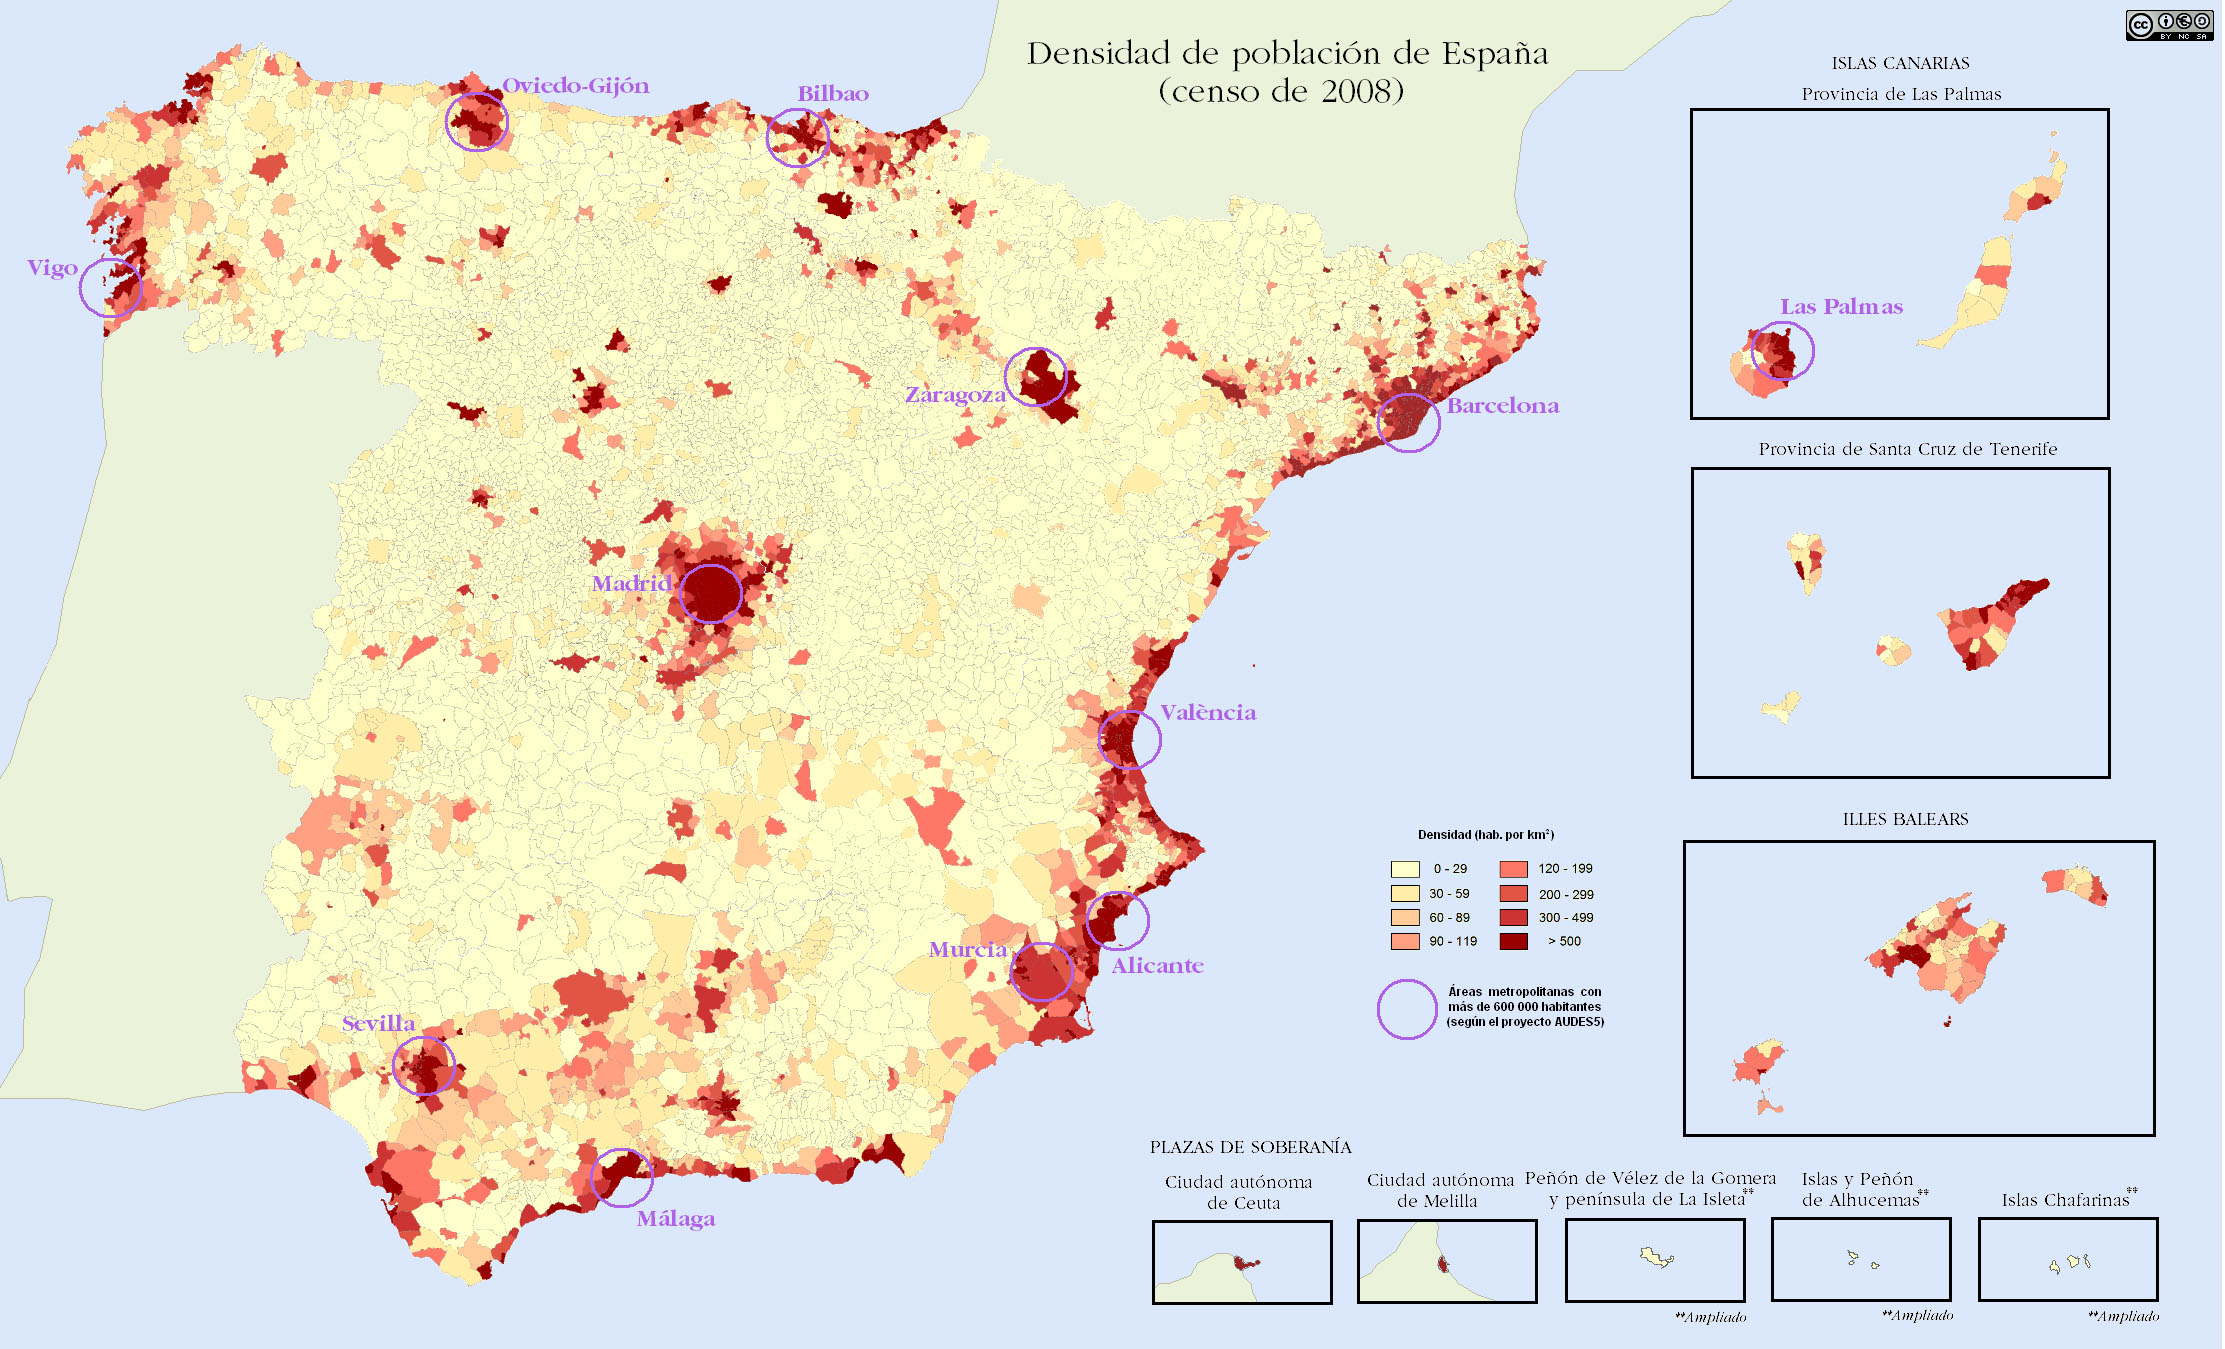
Describe the population distribution shown in fig 1.3. Be detailed in your description (refer to specific regions and cities also include the population densities.
Explain the pattern shown - refer to climate, economic factors, trade opportunities etc.
Identify the core and periphery regions of Spain, support your answer with reasons.
Case Study China
Video 1.1 China population movements
Watch fig 1.4 and Make notes about:
the number of people migrating
The points of origin and destination of the migrants
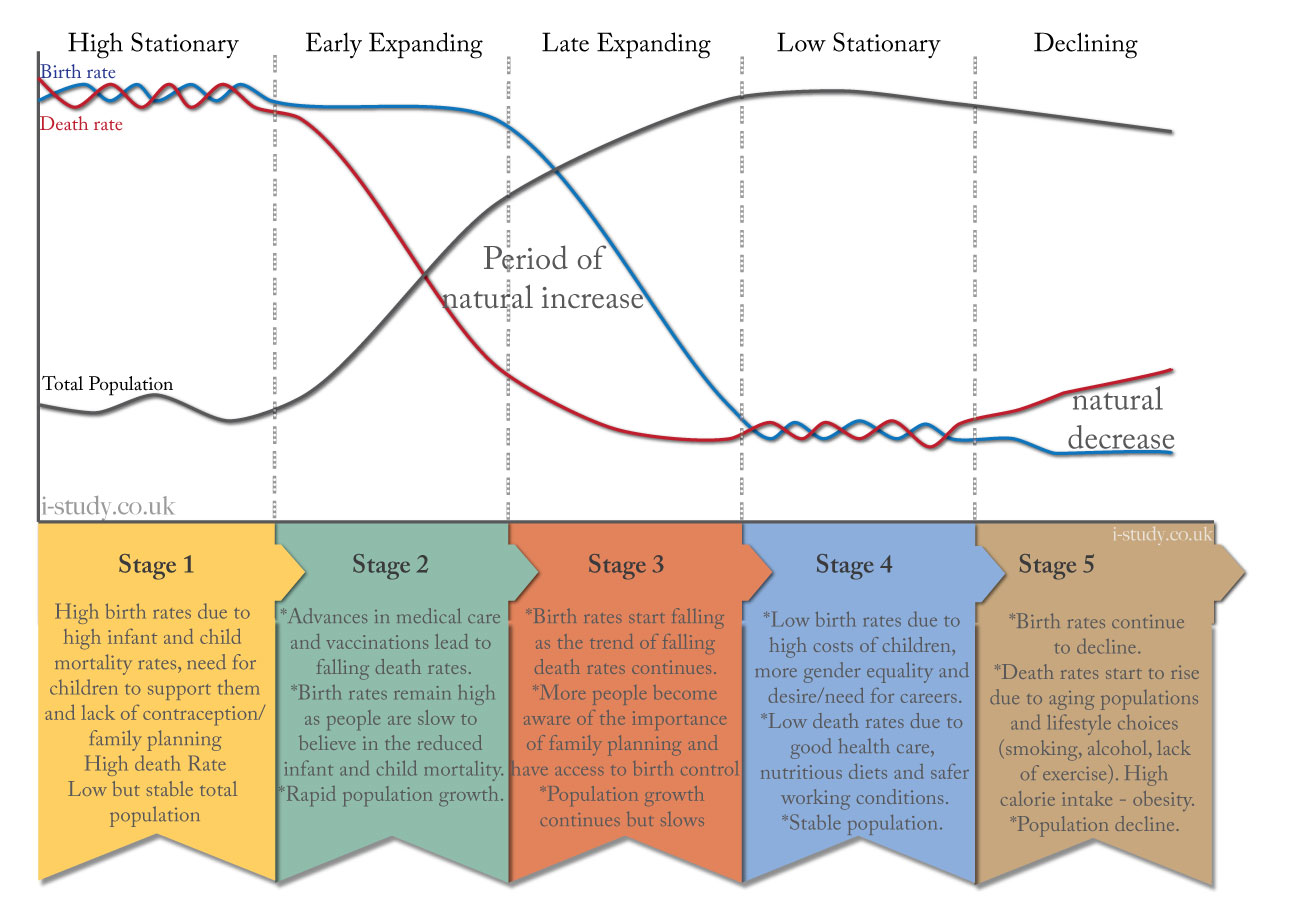
Take a copy of the DTM model and insert into your notes.
Population growth and momentum
Fig 1.5 Population momentum
Watch fig 1.6:
Summarise the main points that are made about population growth and momentum.
Describe the geographical location of the countries that will continue to have the largest growth.
Watch video 1.3 (below) and explain why saving the poorest children is key to reducing population growth.
Video 1.2 Stable populations
Video 1.3 Saving poor children
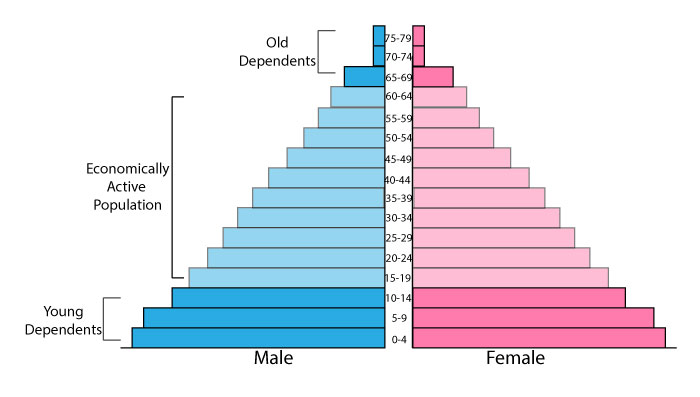
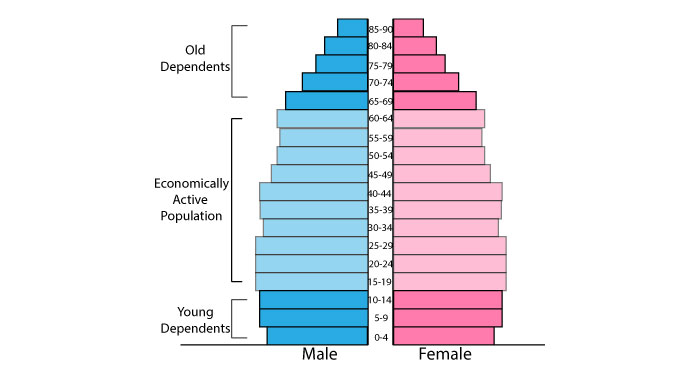
Population pyramids
Fig 1.6 Developing country population pyramid
Fig 1.7 Developed country population pyramid
What?
Population Pyramids are a way of displaying the demographic make up of a country in a simple graph.
They show the number of males and females in each age group.
Importance
Population pyramids are important because they allow governments to predict future population patterns and plan for the changes.
They also give a good indication of the level of development in a country.

